本文以柱形图和饼形图ajax动态赋值为例
一、饼形图赋值步骤
(1)jsp页面
<!-- 引入echarts官方js --> <script src="js/echarts.js"></script> <body> <!-- 为 ECharts 准备一个具备大小(宽高)的 DOM 饼形图 --> <div id="first" style="width: 600px;height:400px;"></div> [html] view plain copy</body>
(2)js页面
//饼图模板var dom = document.getElementById("first");var myChart = echarts.init(dom);var app = {};option = null;option = { title : { text: '用户位置记录', subtext: '', x:'center' }, tooltip : { trigger: 'item', formatter: "{a} <br/>{b} : {c} ({d}%)" }, legend: { orient : 'vertical', x : 'left', data:[] }, toolbox: { show : true, feature : { mark : {show: true}, dataView : {show: true, readOnly: false}, magicType : { show: true, type: ['pie', 'funnel'], option: { funnel: { x: '25%', width: '50%', funnelAlign: 'left', max: 1548 } } }, restore : {show: true}, saveAsImage : {show: true} } }, calculable : true, series : [ { name:'', type:'pie', radius : '55%', center: ['50%', '60%'], data:[] } ] };;if (option && typeof option === "object") { myChart.setOption(option, true);}//饼图动态赋值var year = $("#year-search").val(); var mouth = $("#mouth-search").val(); $.ajax({ type: "get", url: rootPath+"/wxbound/getPieDataByMouth.action", data : {"year":year,"mouth":mouth}, cache : false, //禁用缓存 dataType: "json", success: function(result) { var names=[];//定义两个数组 var nums=[]; $.each(result,function(key,values){ //此处我返回的是list<String,map<String,String>>循环map names.push(values.province_name); var obj = new Object(); obj.name = values.province_name; obj.value = values.count; nums.push(obj); }); myChart.setOption({ //加载数据图表 legend: { data: names }, series: { // 根据名字对应到相应的系列 name: ['数量'], data: nums } }); }, error: function(XMLHttpRequest, textStatus, errorThrown) { alert("查询失败"); } });(3)后台代码根据你自己的代码就好
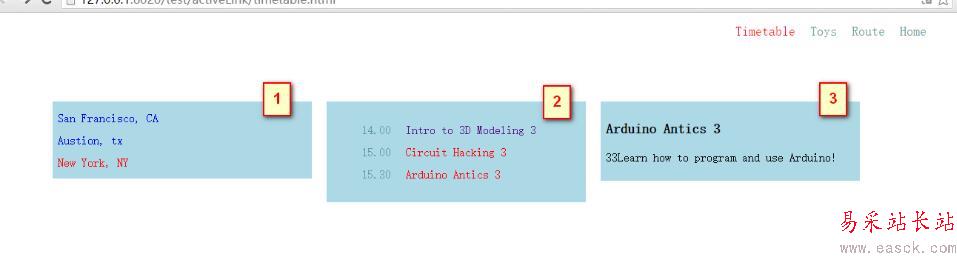
(4)显示样式

二、柱型图赋值步骤
(1)jsp页面
<!-- 引入echarts官方js --> <script src="js/echarts.js"></script> <body> <!-- 为 ECharts 准备一个具备大小(宽高)的 DOM 柱形图 --> <div id="second" style="width: 600px;height:400px;"></div> </body>
新闻热点


疑难解答