首页| 新闻| 科技| 人物| 科学| 话题| 运营| 设计| 开发| 服务器| 学院| 产品| 网文| 娱乐| 游戏| 图片
(编辑:错新网)
个人网站接广告的几个渠道途径
什么是云主机?云主机有啥用?
Windows环境下phpMyAdmin的安装配置办法
甜美的笑容就像一缕阳光
知性、优雅,让人赏心悦目
芜湖有个“松鼠小镇”
小岭南:一个世外桃源的地方
葡萄架下,葡萄熟了
正宗老北京脆皮烤鸭
爷爷都是从孙子走过来的
我太帅了,睡不着咋整啊
新闻热点
疑难解答
图片精选
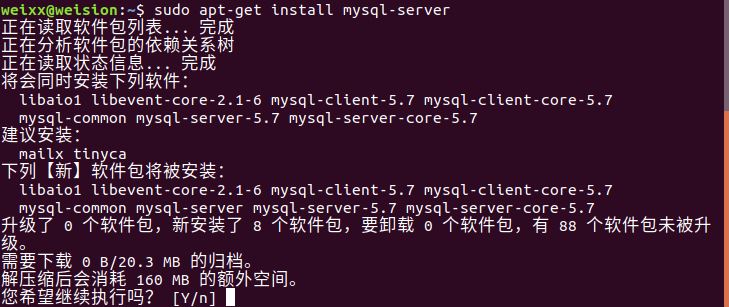
Ubuntu18.04 安装MySQL
MySQL-[Err] 1055 - Expression #1
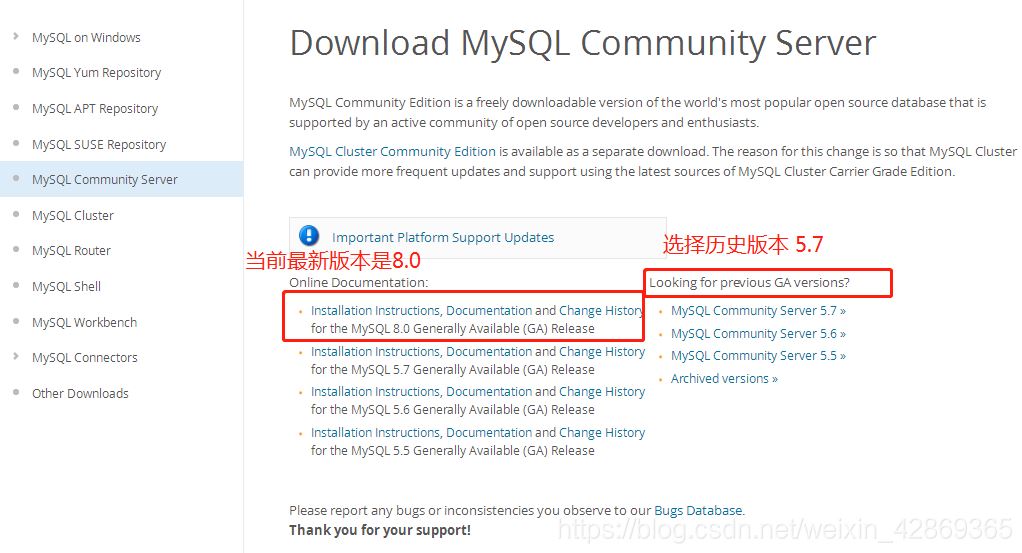
MySQL下载与安装
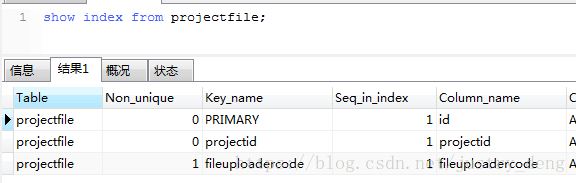
MySQL索引的创建与使用
网友关注